
Ever shipped code that broke… and you didn’t know why?
You push an update. Everything looks fine. A few minutes later, users start dropping off, support tickets trickle in, and somewhere deep in your stack, something is very wrong.
But here’s the kicker: you don’t know what broke. Or where. Or how often.
Sound familiar?
If you’ve built anything beyond a simple landing page, you’ve probably been there. Debugging in production can feel like trying to fix a car while it’s still moving.
That’s exactly the problem tools like Sentry aim to solve.
What is Sentry (and why do people swear by it)?
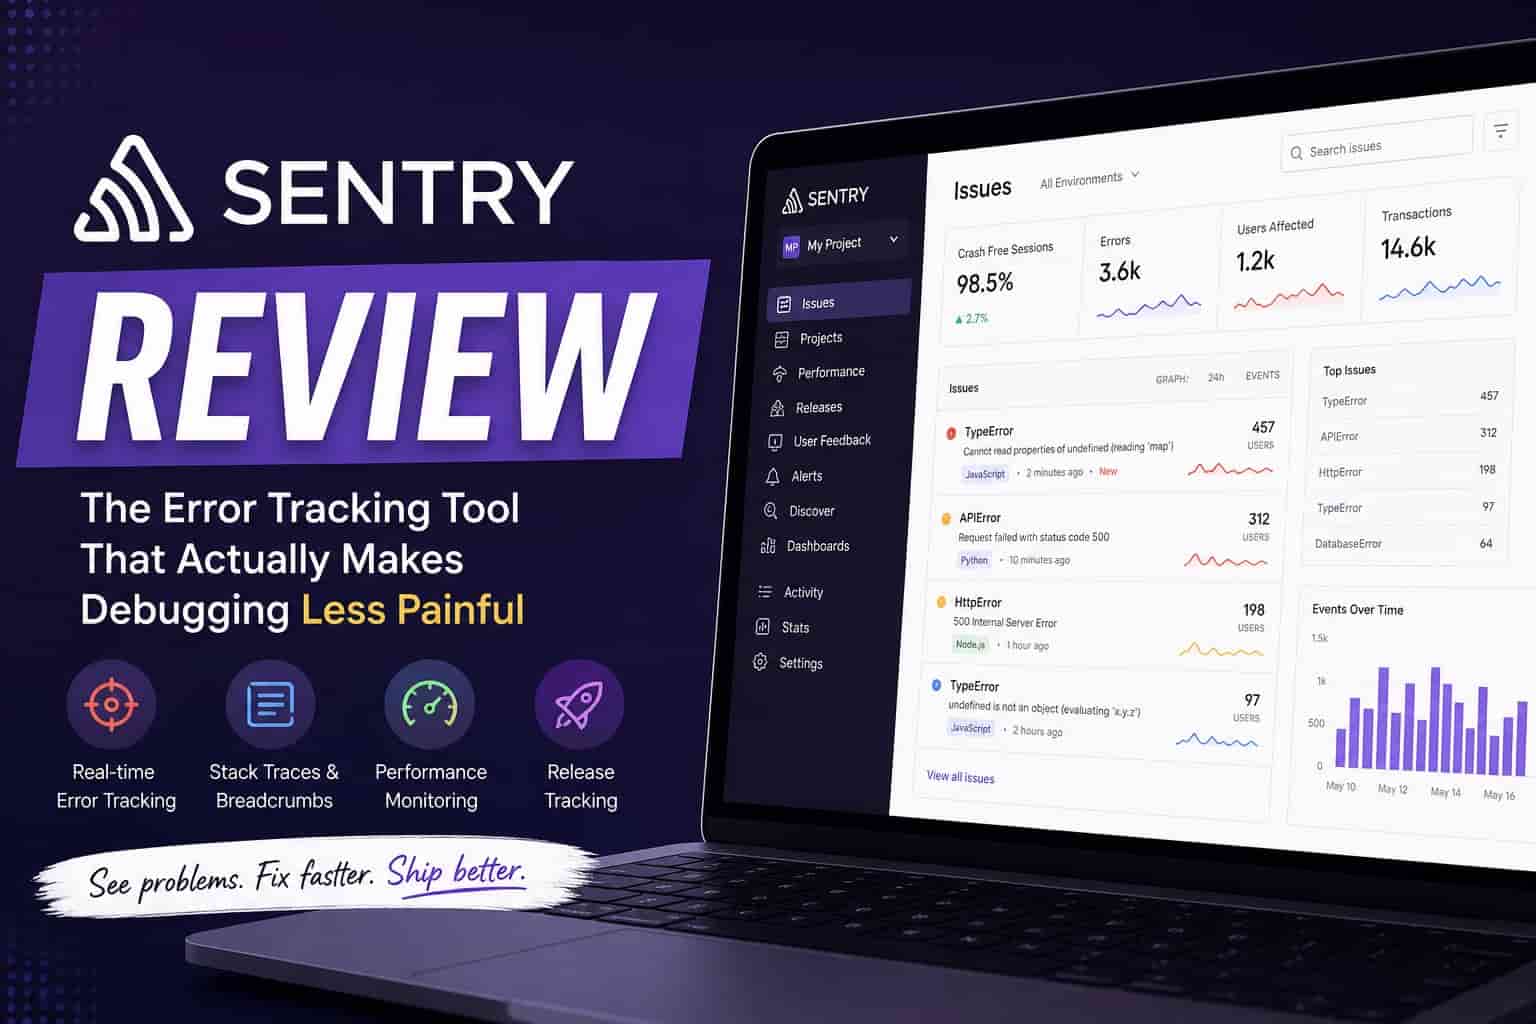
At its core, Sentry is an error tracking and performance monitoring tool. But calling it just that undersells it a bit.
It’s more like a real-time window into what your app is doing when things go wrong.
Instead of relying on vague bug reports like “the app crashed,” Sentry gives you:
- The exact error message
- The stack trace
- The user’s environment (browser, device, OS)
- Breadcrumbs leading up to the crash
In other words, it tells you not just that something broke but why.
And honestly, that’s the difference between guessing and fixing.
The real problem: debugging in the dark
Let’s be specific.
Without a tool like Sentry, debugging often looks like this:
- A user reports a bug with minimal detail
- You try to reproduce it locally
- It works fine (of course it does)
- You add logs… redeploy… wait
- Repeat until you’re mildly frustrated
Now scale that across:
- Multiple devices
- Different browsers
- Various API conditions
- Real users doing unpredictable things
It gets messy fast.
That’s where Sentry shines, it captures errors as they happen, in real environments, without relying on guesswork.
Key features that actually matter
There’s a lot under the hood, but a few features stand out in day-to-day use.
1. Real-time error tracking
Sentry alerts you the moment something breaks.
You don’t need to wait for users to complain. You’ll see:
- Error frequency
- Affected users
- First seen / last seen timestamps
It’s surprisingly satisfying to catch issues before your users do.
2. Stack traces that make sense
Not all stack traces are created equal.
Sentry organizes them cleanly, highlights the relevant parts, and even groups similar errors together. That means:
- Less noise
- Faster diagnosis
- Fewer duplicate headaches
3. Breadcrumbs (the underrated hero)
Breadcrumbs track the sequence of events leading up to an error.
Think:
- Button clicks
- API calls
- Navigation changes
It’s like watching a replay of what the user did right before things went sideways.
And yes, this saves hours.
4. Performance monitoring
Sentry isn’t just about crashes.
It also tracks:
- Slow API responses
- Long page loads
- Database bottlenecks
This is where it starts competing with tools like New Relic or Datadog but with a simpler setup.
5. Release tracking
Ever fixed a bug but weren’t sure if it actually worked?
Sentry ties errors to specific releases, so you can:
- See if a new deploy introduced issues
- Confirm fixes
- Track stability over time
It’s a small feature that quietly improves your workflow.
Setting up Sentry (it’s easier than you think)
One of the reasons Sentry is popular? Setup is pretty painless.
Here’s the simplified version:
Step 1: Create a project
Sign up, pick your platform (JavaScript, Python, Node, etc.), and create a project.
Step 2: Install the SDK
For example, in a JavaScript app:
npm install @sentry/browserStep 3: Initialize it
Add a few lines to your code:
Sentry.init({
  dsn: "your-dsn-url"
});
That’s it. Seriously.
From there, Sentry starts collecting errors automatically.
Step 4: (Optional but recommended) Customize
You can:
- Add user context
- Track custom events
- Filter out noise
This is where it goes from “useful” to “indispensable.”
Real-world use cases
Let’s make this practical.
Scenario 1: A broken checkout flow
You run an e-commerce site.
Users suddenly stop completing purchases. Revenue drops. Panic sets in.
Sentry shows:
- A JavaScript error on the payment page
- It only affects Safari users
- Triggered after a specific button click
Boom. You fix it in minutes instead of hours.
Scenario 2: Mobile app crashes
Your mobile app works fine in testing, but crashes for some users.
Sentry reveals:
- It’s happening on older Android versions
- Linked to a specific API response
- Occurs under poor network conditions
Without Sentry? You’d be guessing.
Scenario 3: Slow performance
Your app feels sluggish, but nothing is technically “broken.”
Sentry’s performance monitoring shows:
- One endpoint taking 3 seconds
- A database query causing the delay
Now you have a clear target to optimize.
Pros and cons (no sugarcoating)
What Sentry does really well
- Excellent error visibility – You see exactly what went wrong
- Fast setup – Minimal friction to get started
- Clean UI – Not perfect, but very usable
- Strong integrations – Works with GitHub, Slack, and more
- Generous free tier – Great for small projects
Where it can fall short
- Can get noisy – Without filtering, you’ll see a lot of errors
- Pricing scales quickly – Larger teams may feel it
- Performance features aren’t as deep as dedicated APM tools
- Learning curve for advanced features – Not steep, but it’s there
Pricing: is it worth it?
Sentry offers a free plan, which is surprisingly capable.
You get:
- Basic error tracking
- Limited events per month
- Core integrations
For many small projects, that’s enough.
Paid plans unlock:
- More events
- Advanced performance monitoring
- Team collaboration features
Is it worth paying?
If your app has users (and especially if it makes money), yes. Debugging faster often pays for itself.
Sentry vs alternatives
Let’s be honest, Sentry isn’t the only player here.
Sentry vs New Relic
- New Relic: deeper performance insights
- Sentry: better error tracking, easier setup
If you care more about crashes than infrastructure metrics, Sentry wins.
Sentry vs Datadog
- Datadog: powerful, but complex
- Sentry: focused and developer-friendly
Datadog feels like an enterprise tool. Sentry feels like something you’ll actually enjoy using.
Sentry vs console.log (yes, really)
Look, we’ve all done it.
But relying on logs alone is like trying to diagnose a car problem by listening to the engine from across the street.
Sentry gives you context. Logs don’t.
A few personal observations
After using Sentry for a while, one thing stands out: it changes how you think about bugs.
You stop reacting to problems and start anticipating them.
Also, and this might just be me, it’s oddly reassuring to see errors clearly. Even if there are a lot of them, at least you know what you’re dealing with.
Silence is worse.
Tips to get the most out of Sentry
If you decide to use it, don’t just install and forget.
A few quick tips:
- Set up alert rules so you’re notified only when it matters
- Group and ignore minor errors to reduce noise
- Add user context for better debugging
- Track releases consistently
These small tweaks make a big difference.
Who should use Sentry?
Sentry is a great fit if you:
- Build web or mobile apps
- Care about user experience
- Want faster debugging
- Work in a team (or plan to)
It might be overkill if you’re just building static sites or tiny personal projects but even then, the free plan makes it tempting.
Final thoughts: is Sentry worth it?
Short answer: yes.
Longer answer: Sentry isn’t flashy, but it solves a very real problem and it does it well.
It won’t magically eliminate bugs (nothing will), but it will make them easier to understand and fix.
And that’s half the battle.
If you’re currently debugging issues manually or relying on user reports, try this:
- Set up Sentry on one project
- Let it run for a week
- See what it catches
Chances are, you’ll discover issues you didn’t even know existed.
And once you see that kind of visibility, it’s hard to go back.